pydgilib_extra package
Submodules
pydgilib_extra.dgilib_calculations module
This module holds the functions that do calculations on Interface Data.
-
class
pydgilib_extra.dgilib_calculations.GPIOAugmentEdges[source]¶ Bases:
pydgilib_extra.dgilib_calculations.StreamingCalculationGPIO Augment Edges.
-
gpio_augment_edges(gpio_data, delay_time=0, switch_time=0)[source]¶ GPIO Augment Edges (streaming).
Augments the edges of the GPIO data by inserting an extra sample of the previous pin values at moment before a switch occurs (minus switch_time ). The switch time is measured to be around 0.3 ms.
Also delays all time stamps by delay_time. The delay time seems to vary a lot between different projects and should be manually specified for the best accuracy.
Can insert the last datapoint again at the time specified (has to be after last sample).
- Parameters
gpio_data (InterfaceData) – InterfaceData object of GPIO data.
delay_time (float) – Switch time of GPIO pin.
switch_time (float) – Switch time of GPIO pin.
- Returns
InterfaceData object of augmented GPIO data.
- Return type
-
-
pydgilib_extra.dgilib_calculations.calculate_average(power_data, start_time=None, end_time=None, start_index=1)[source]¶ Calculate average value of the power_data using the left Riemann sum.
- Arguments:
- power_data {InterfaceData} – Instance of InterfaceData with power
samples.
- Keyword Arguments:
- start_time {float} – Timestamp of first sample to include (default:
{None})
- end_time {float} – Timestamp to of last sample to include (default:
{None})
- start_index {int} – Index to start search for start time at (default:
{1})
- Returns:
[type] – [description]
-
pydgilib_extra.dgilib_calculations.power_and_time_per_pulse(logger_data, pin, start_time=0.01, end_time=inf, stop_function=None, initialized=False, pulse_direction=True)[source]¶ Calculate power and time per pulse.
Takes the data and a pin and returns a list of power and time sums for each pulse of the specified pin.
NOTE: This returns time durations in the sampling frame of the power timestamps. Hence the list of times this function returns will not exactly match with the difference between rise timestamp and fall timestamp of the of the GPIO pin.
- Parameters
data (LoggerData) – LoggerData object. Needs to have GPIO and Power data.
pin (int) – Number of the GPIO pin to be used.
start_time (float) – First timestamp to consider (defaults to 0.01 to skip GPIO initialization).
end_time (float) – Last timestamp to consider.
stop_function (function) – Function to evaluate on pin_values. If it returns True the loop will stop.
initialized (bool) – If False: Skip first occurrences of all pins high
pulse_direction (bool) – If True: detect pulse as False -> True -> False, else detect pulse as True -> False -> True
- Returns
List of list of power and time sums.
- Return type
-
pydgilib_extra.dgilib_calculations.rise_and_fall_times(logger_data, pin, start_time=0.01, end_time=inf, stop_function=None, initialized=False, pulse_direction=True)[source]¶ rise_and_fall_times.
[description]
- Arguments:
logger_data {[type]} – [description] pin {[type]} – [description]
- Keyword Arguments:
start_time {float} – [description] (default: {0.01}) end_time {[type]} – [description] (default: {float(“Inf”)}) stop_function {[type]} – [description] (default: {None}) initialized {bool} – [description] (default: {False}) pulse_direction {bool} – [description] (default: {True})
- Returns:
[type] – [description]
pydgilib_extra.dgilib_data module
This module provides classes to store DGILib Logger Interface Data.
-
class
pydgilib_extra.dgilib_data.InterfaceData(*args)[source]¶ Bases:
objectClass to store DGILib Logger Interface Data.
Take tuple of timestamps and values.
-
__add__(interface_data)[source]¶ Append new interface_data (copy).
Used to provide interface_data2 = interface_data1 + interface_data syntax
-
__getitem__(index)[source]¶ Get item.
Used to provide timestamp, value = interface_data[5] and timestamp, value = interface_data[2:5] syntax
-
__iadd__(interface_data)[source]¶ Append new interface_data (in-place).
Used to provide interface_data += interface_data1 syntax
-
get_select_in_value(begin=0, end=None, start_time=None, end_time=None)[source]¶ get_select_in_value.
Use to slice a items in the values when the values are iterables.
- Keyword Arguments:
begin {int} – Begin index of item in value (default: {0}) end {[type]} – End index of item in value, if not supplied only
the item the begin index will be returned (default: {None})
start_time {[type]} – Start time of selection (default: {None}) end_time {[type]} – End time of selection (default: {None})
- Returns:
- [list] – List of values that have timestamps between start_time
and end_time
-
timestamps
-
values
-
-
class
pydgilib_extra.dgilib_data.LoggerData(*args, **kwargs)[source]¶ Bases:
dictClass to store DGILib Logger Data.
Take list of interfaces for the data.
-
__add__(logger_data)[source]¶ Append new logger_data (copy).
Used to provide logger_data2 = logger_data1 + logger_data syntax
-
__iadd__(logger_data)[source]¶ Append new logger_data (in-place).
Used to provide logger_data1 += logger_data syntax
-
pydgilib_extra.dgilib_extra module
This module provides user friendly way to interact with the DGILib API.
-
class
pydgilib_extra.dgilib_extra.DGILibExtra(*args, **kwargs)[source]¶ Bases:
pydgilib.dgilib.DGILibA user friendly way to interact with the DGILib API.
Instantiate DGILibExtra object.
-
__exit__(exc_type, exc_value, traceback)[source]¶ For usage in
with DGILibExtra() as dgilib:syntax.
-
default_enabled_interfaces= [48, 256]
-
default_loggers= [0]
-
empty_data(interfaces=None)[source]¶ Populate self.data with an empty data structure (of type
LoggerData).
-
get_time_factor()[source]¶ Get the factor to multiply timestamps by to get seconds.
- Returns
Timer factor
- Return type
-
info()[source]¶ Get the build information of DGILib.
- Returns
Version information of DGILib:
major_version: the major_version of DGILib
minor_version: the minor_version of DGILib
build_number: the build number of DGILib. 0 if not supported
major_fw: the major firmware version of the connected DGI device
minor_fw: the minor firmware version of the connected DGI device
- Return type
-
pydgilib_extra.dgilib_extra_config module
Configuration for PyDGILibExtra.
pydgilib_extra.dgilib_extra_exceptions module
Custom Exceptions for DGILibExtra.
-
exception
pydgilib_extra.dgilib_extra_exceptions.InterfaceNotAvailableError(msg)[source]¶ Bases:
pydgilib.dgilib_exceptions.ErrorException raised when enabling interface.
__init__.
-
exception
pydgilib_extra.dgilib_extra_exceptions.PowerReadError(msg)[source]¶ Bases:
pydgilib.dgilib_exceptions.ErrorException raised when reading power buffer.
__init__.
-
exception
pydgilib_extra.dgilib_extra_exceptions.PowerStatusError(msg)[source]¶ Bases:
pydgilib.dgilib_exceptions.ErrorException raised when checking auxiliary_power_get_status().
__init__.
pydgilib_extra.dgilib_interface module
This module provides a base interface class.
-
class
pydgilib_extra.dgilib_interface.DGILibInterface(*args, **kwargs)[source]¶ Bases:
objectProvides a base interface class.
Instantiate DGILibInterface object.
-
csv_header= ['timestamp', 'value']
-
file_name_base= 'log'
-
init_csv_writer(log_folder='C:\\Users\\erikw_000\\Documents\\GitHub\\pydgilib\\docs', newline='', mode='w')[source]
-
interface_id= -1
-
name= 'interface_name'
-
polling_type= 0
-
pydgilib_extra.dgilib_interface_gpio module
This module wraps the calls to the GPIO interface.
-
class
pydgilib_extra.dgilib_interface_gpio.DGILibInterfaceGPIO(*args, **kwargs)[source]¶ Bases:
pydgilib_extra.dgilib_interface.DGILibInterfaceWraps the calls to the GPIO interface.
Instantiate DGILibInterfaceGPIO object.
-
csv_header= ['timestamp', 'gpio0', 'gpio1', 'gpio2', 'gpio3']
-
default_gpio_delay_time= 0.00075
-
get_config()[source]¶ Get the pin-mode for the GPIO pins.
The GPIO configuration controls the direction of the pins.
Input pins: Setting a bit to 1 means the pin is monitored. Output pins: Setting a bit to 1 means the pin is set to output and can be controlled by the send command.
-
interface_id= 48
-
name= 'gpio'
-
set_config(*args, **kwargs)[source]¶ Set the pin-mode for the GPIO pins.
The GPIO configuration controls the direction of the pins, and enables the interface if needed.
Input pins: Setting a bit to 1 means the pin is monitored. Output pins: Setting a bit to 1 means the pin is set to output and can be controlled by the send command.
If any of the pins are set to read mode or write mode the GPIO interface will be enabled. If none of the pins are set to read mode or write mode the GPIO interface will be disabled.
-
pydgilib_extra.dgilib_interface_power module
This module wraps the calls to the Power Interface.
-
class
pydgilib_extra.dgilib_interface_power.DGILibInterfacePower(*args, **kwargs)[source]¶ Bases:
pydgilib_extra.dgilib_interface.DGILibInterfaceWraps the calls to the Power interface.
Instantiate DGILibInterfacePower object.
-
auxiliary_power_calibration(circuit_type=16)[source]¶ Calibrate the Auxiliary Power interface of the device.
- Parameters
circuit_type (int) – Type of calibration to trigger(defaults to XAM)
-
calibrate(force=False)[source]¶ Calibrate the Auxiliary Power interface of the device.
Check if calibration is valid and trigger calibration if it is not.
- Parameters
force (bool) – Force calibration, even if it is valid (default: False)
- Raises
PowerReadError – No description given.
PowerStatusError – No description given.
-
csv_header= ['timestamp', 'current']
-
interface_id= 256
-
name= 'power'
-
polling_type= 1
-
pydgilib_extra.dgilib_logger module
This module wraps the logging functionality for DGILibExtra.
-
class
pydgilib_extra.dgilib_logger.DGILibLogger(*args, **kwargs)[source]¶ Bases:
objectWraps the logging functionality for DGILibExtra.
- Interfaces:
GPIO mode
Power mode
Instantiate DGILibInterfacePower object.
-
log(duration=10, stop_function=None, min_duration=0.2)[source]¶ Run the logger for the specified amount of time.
- Parameters
duration (int) – Amount of time to log data (default: 10).
stop_function (callable) – Function that will be evaluated on the collected data. If it returns True the logging will be stopped even if the duration has not been reached (default: None).
- Returns
Returns the logged data as a
LoggerDataobject if LOGGER_OBJECT was passed to the logger.- Return type
-
start_polling(interface_ids=None)[source]¶ Starts polling on the specified interfaces. By default polling will be started for all enabled interfaces.
-
stop_polling(interface_ids=None)[source]¶ Stops polling on the specified interfaces. By default polling will be stopped for all enabled interfaces.
pydgilib_extra.dgilib_plot module
-
class
pydgilib_extra.dgilib_plot.DGILibPlot(dgilib_extra=None, *args, **kwargs)[source]¶ Bases:
objectThe DGILibPlot class is responsible with plotting the electrical current (Amperes) data and gpio state data (values of 1/0) obtained from an Atmel board.
The X axis represents time in seconds, while the Y axis represents the electrical current in Amperes.
There are two ways that the gpio pins state can be shown along with the electrical current. One is the line method and one is the highlight method. The line method shows a square waveform, a typical byproduct of the digital signal that gpio pins usually have. The highlight method highlights only particular parts of the plot with semi-transparent coloured areas, where the pins have a value of interest (set using the
plot_pins_valuesargument of the class).Below are shown some examples of DGILibPlot and the two methods of drawing the gpio pins (line/highlight).
Example plots using “line” method:
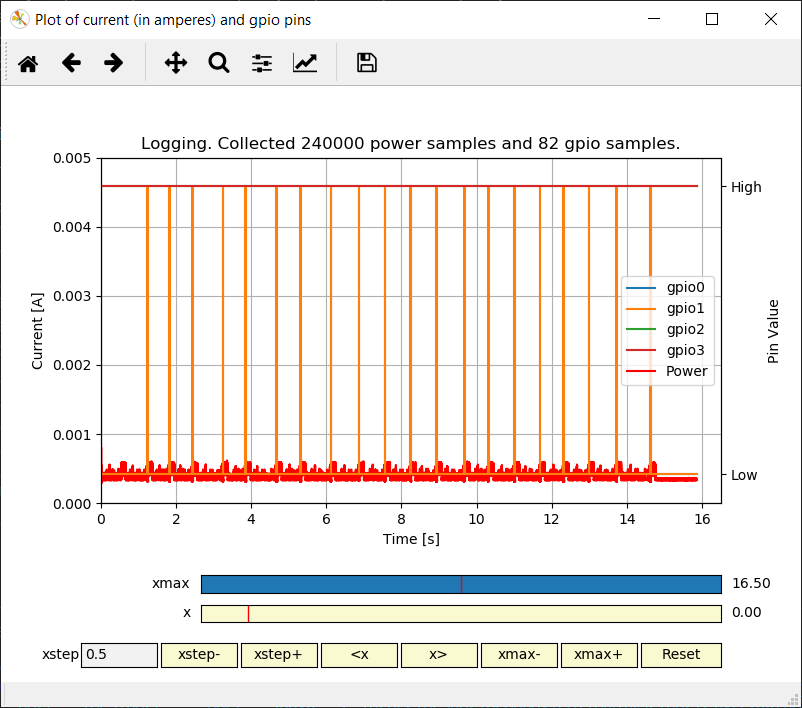
Figure 1: Example of plot with the ‘line’ method chosen for the drawing of pins. All of the pins are being plotted, so you can always see their True/False values.
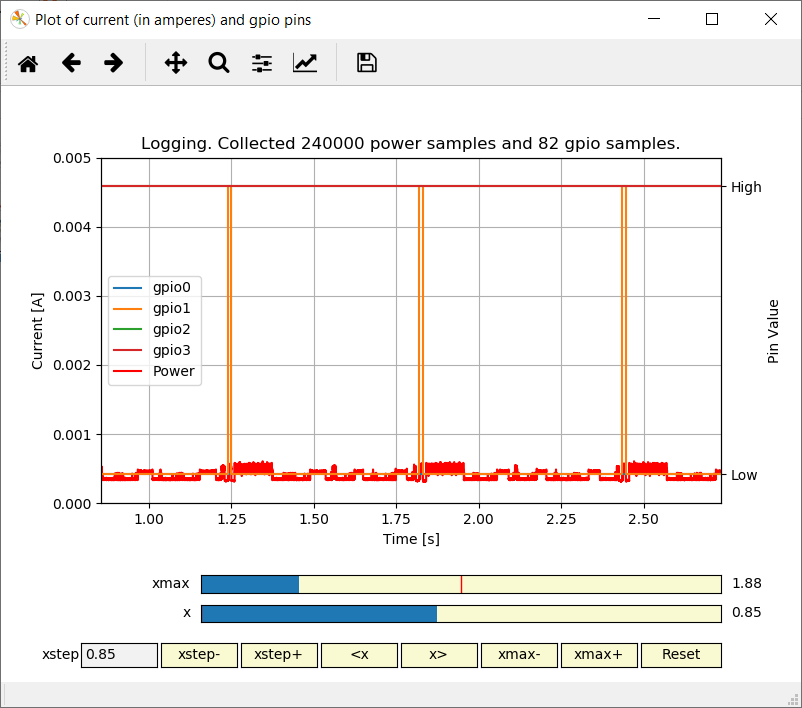
Figure 2: The same plot with the same data as figure 1, only zoomed in.
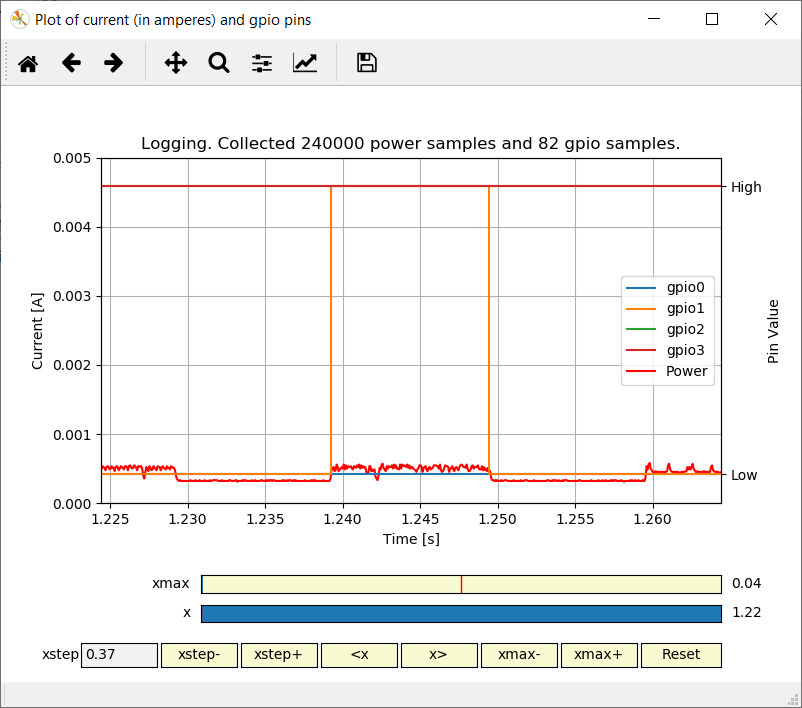
Figure 3: The same plot with the same data as figure 1 and 2, only even more zoomed in. Here we can clearly see that gpio pins 0, 2 and 3 have defaulted on a single value all along the program’s execution on the board. We can however clearly see the toggling of pin 1, represented in orange.
Example plots using “highlight” method:
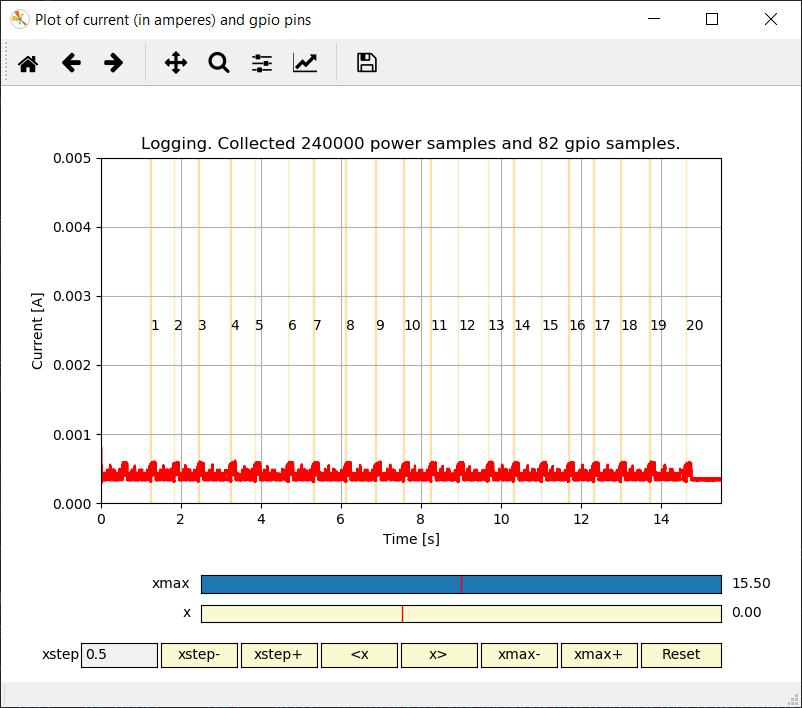
Figure 4: Example of plot with the ‘highlight’ method chosen for the drawing of pins. The time the pins are holding the value of interest (in this case, True value) is small every time. This is why we can see the highlighted areas looking more like vertical lines when zoomed out. The only pin being toggled by the program on the board is pin 1, hence it’s why we only see one color of highlighted areas.
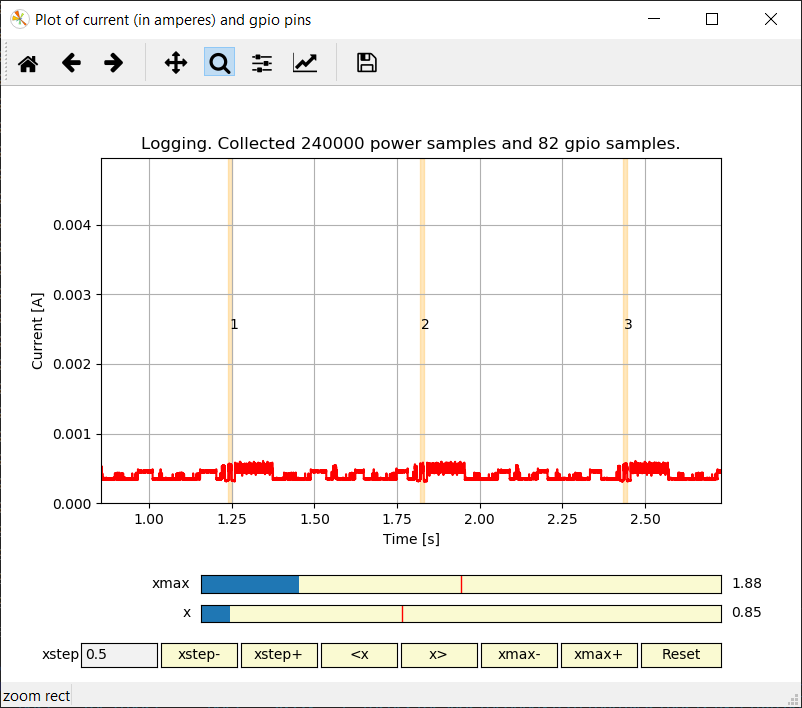
Figure 5: The same plot with the same data as figure 1, only zoomed in.
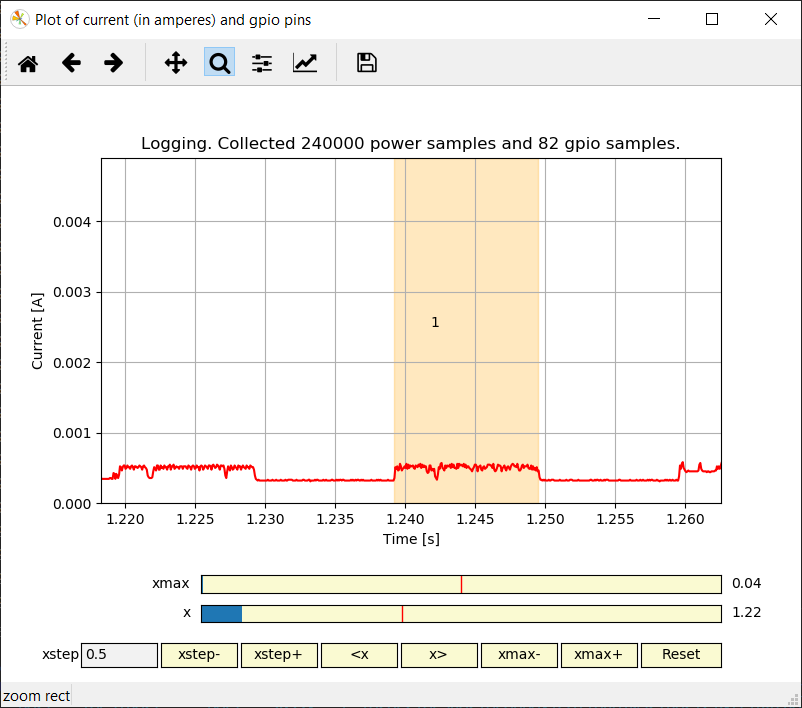
Figure 6: The same plot with the same data as figure 1 and 2, only even more zoomed in. Now we can see one of the the highlight area in its proper form.
Parameters
The parameters listed in the section below can be passed as arguments when initializing the DGILibPlot object, or as arguments to a DGILibExtra object. They can be included in a configuration dictionary (
dictobject) and then unwrapped in the initialization function call of either the DGILibPlot object or the DGILibExtra object (by doing:dgilib_plot = DGILibPlot(**config_dict)orwith DGILibExtra(**config_dict) as dgilib: ...).- Parameters
dgilib_extra (DGILibExtra) –
A DGILibExtra object can be specified, from where the plot can obtain the electrical current and gpio state data. If a DGILibExtra object is not desired to be specified however, then it should be set to None.
(the default is None, meaning that measurements data (in the form of a
DGILibDatashould be manually called as function updates))fig (matplotlib.pyplot.figure, optional) –
If it is wanted so that the data is to be plotted on an already existing matplotlib figure, then the object representing the already instantiated figure can be specified for this parameter. For example, the electrical current data and gpio state data can be plotted in a subplot of a figure window that holds other plots as well.
(the default is None, meaning that a new figure object will be created internally)
ax (matplotlib.pyplot.axes, optional) –
If it is wanted so that the data is to be plotted on an already existing matplotlib axes, then the object representing the already instantiated axes can be specified for this parameter.
(the default is None, meaning that a new axes object will be created internally)
ln (matplotlib.pyplot.lines2d, optional) –
If it is wanted so that the data is to be plotted on an already existing matplotlib Lines2D object, then the object representing the already instantiated Lines2D object can be specified for this parameter.
(the default is None, meaning that a new Lines2D object will be created internally)
window_title (str, optional) –
If another window title than the default is desired to be used, it can be specified here.
(the default is
Plot of current (in amperes) and gpio pins)plot_xmax (int, optional) –
This initializes the figure view to a maximum of plot_xmax on the X axis, where the data to be plotted. Later, the user can change the figure view using the bottom sliders of the plot figure.
(the default is an arbitrary 10)
plot_ymax (int, optional) –
This initializes the figure view to a maximum of plot_xmax on the Y axis, where the data to be plotted. Later, the user can change the figure view using the bottom sliders of the plot figure.
(the default is 0.005, meaning 5 mA, so that something as energy consuming as a blinking LED can be shown by a DGILibPlot with default settings)
plot_pins (list(bool, bool, bool, bool), optional) –
Set the pins to be drawn in the plot, out of the 4 GPIO available pins that the Atmel board gives data about to be sent through the computer through the Atmel Embedded Debugger (EDBG) Data Gateway Interface (DGI).
(the default is [True, True, True, True], meaning all pins are drawn)
plot_pins_method (str, optional) –
Set the method of drawing the pin. The values can be either
"line"or"highlight". Refer to the above figures to see the differences.(the default is “highlight”)
plot_pins_colors (list(str, str, str, str), optional) –
Set the colors of the semi-transparent highlight areas drawn when using the highlight method, or the lines when using the lines method of drawing pins.
(the default is [“red”, “orange”, “blue”, “green”], meaning that pin 0 will have a red semi-transparent highlight area or line, pin 1 will have orange ones, and so on)
automove_method (str, optional) –
When the plot is receiving data live from the measurements taken in real-time from the board (as opposed to receiving all the data to be plotted at once, say, when reading the data from saved csv files), and plot_xmax is smaller than the expected size of the data in the end, then at some point the data will update past the figure view. DGILibPlot automatically moves the figure view to the last timestamp of the latest data received, and it can do so in two ways, depending on the value of
automove_method.The page method changes the figure view in increments of
plot_ymax, when the data updates past the figure view, as if the plot is turning one “page” at a time. The latest_data method makes the figure view always have the latest data in view, meaning that it moves in small increments so that it always keeps the latest data point 0.15 seconds away from the right edge of the figure view. The 0.15 seconds value is an arbitrary hard-coded value, chosen after some experiments.(the default is ‘latest_data’, meaning the plot’s figure view will follow the latest data in smaller increments, keeping the latest data always on the right side of the plot)
verbose (int) –
Specifies verbosity:
0: Silent
1: Currently prints if data is missing, either as an object or as values, when
update_plot()is being called.
(the default is 0)
-
axvspans¶ The way the semi-transparent coloured areas for the gpio pins are drawn on the plot is by using
matplotlib.pyplot.axvspanobjects. The axvspan objects are collected in a list for potential use for later. (e.g.: such as to delete them, using theclear_pins()method).(the default is 4 empty lists, meaning no highlighting of areas of interest has occured yet)
- Type
list(4 x list(matplotlib.pyplot.axvspan))
-
annotations¶ As we have seen in figures 4, 5, 6, for the highlight method of drawing pins, the counting or iteration of the highlighted areas are also showed on the plot. There are 4 pins, so therefore 4 lists of the counting/iteration stored as strings are saved by the DGILibPlot for later use by developers (e.g.: to replace from numbers to actual descriptions and then call the redrawing of pins).
(the default is 4 empty lists, meaning no annotations for the highlighted areas of interest were placed yet)
-
preprocessed_averages_data¶ As the highlight method draws the pins on the plot with the help of the
HoldTimesclass, that means the plot knows afterwards the time intervals in which the pins have values of interest. This can be valuable for a subsequent averaging function that wants to calculate faster the average current or energy consumption of the the board activity only where it was highlighted on the plot. As such, DGILibPlot prepares a list of 4 lists of tuples, each for every pin, the tuple containing the iteration index of the highlighted area of interest the pins kept the same value consecutively (called a hold time), another tuple containing the timestamps with respect to the electrical current data, which says the beginning and end times of that hold interval, an index in the list of the electrical current data points where the respective hold time starts and, lastly, a None value, which then should be replaced with afloatvalue for the the average current or charge during that hold time.(the default is 4 empty lists, meaning no gathered preprocessed averages data yet)
-
iterations¶ As the plot is being updated live, the iterations list holds the number of highlighed areas that have been drawn already for for each pin. As the whole measurement data gets plotted, the iterations list practically holds the number of iterations the of all the areas of interest for each pin (which can be, for example, the number of for loops that took place in the program itself running on the board).
(the default are 4
0values, meaning no areas of interest on the gpio data has been identified)- Type
list(4 x int)
-
last_xpos¶ As the plot is being updated live, the figure view moves along with the latest data to be shown on the plot. If the user desires to stop this automatic movement and focus on some specific area of the plot, while the data is still being updated in real-time, the figure needs to detect that it should stop following the data to not disturb the user. It does so by comparing the current x-axis position value of the x axis shown, with the last x-axis position value saved, before doing any automatic movement of the figure view. If they are different, no automatic movement is being done from now on.
- Type
-
xylim_mutex¶ As there are many ways to move, zoom and otherwise manipulate the figure view to different sections of the plot, using the matplotlib’s implicit movement and zoom controls, or the freshly built DGILibPlot sliders appearing at the bottom (See figures), or the automatic following of the latest data feature, there is a multi-threading aspect involved and therefore a mutex should be involved, in the form of a Lock object, to prevent anomalies.
- Type
Lock
-
hold_times_obj¶ Only instantiated when highlight method is being used for drawing pins information, the
HoldTimesclass holds the algorithm that works on the live data to obtain the timestamps of areas of interest of the gpio data, in order to be highlighted on the plot. As the algorithm works on live updating data, the areas of interst can be cut off between updates of data. As such, theHoldTimeskeeps information for the algorithm to work with, in order to advert this.- Type
-
clear_pins()[source]¶ Clears the highlighted areas on the plot that represent the state of the gpio pins (as seen in figures 4, 5, 6). Using this method only makes sense if the highlight method of drawing pins was used.
-
draw_pins(data)[source]¶ draw_pins [summary]
- Raises
ValueError – Raised when plot_pins_method member of class has another string value than the ones available (highlight, line)
- Parameters
data (DGILibData) –
DGILibDataobject that contains the GPIO data to be drawn on the plot.
-
pause(time=1e-06)[source]¶ Calls matplotlib’s pause function for an amount of seconds.
- Parameters
time (float) – The number of seconds the plot should have time to refresh itself and pause program functionality.
-
plot_still_exists()[source]¶ Can be used in a boolean (e.g.: if, while) clause to check if the plot is still shown inside a window (e.g.: to unpause program functionality if the plot is closed).
Also used in the
keep_plot_alive()member function of the class.- Returns
Returns True if the plot still exists and False otherwise.
- Return type
-
refresh_plot()[source]¶ Makes a few matplotlib specific calls to refresh and redraw the plot (especially when new data is to be drawn).
Is used in
update_plot()member function of the class.
Module contents
This module provides Python bindings for DGILib Extra.